Nothing suspicious found on a first look... (ONLY RECONSTRUCTED VARIABLES CONSIDERED)
Details: histograms normalized to 10pb-1 statistics.
(For histograms normalized to the same number of entries, see here.
(NLO Crosssections for 7 TeV (MCFM with MSWT08 NLO central PDFs): Wplus->munu (|etamu|<2.5) : 4.7919 +- 0.0064 nb Wminus->munu (|etamu|<2.5) : 2.9045 +- 0.0032 nb Sum for W->munu (|etamu|<2.5) : 7.6964 +- 0.0072 nb Wplus->munu (no cuts) : 6.0500 +- 0.0042 nb Wminus->munu (no cuts) : 4.2622 +- 0.0029 nb Sum for W->munu (no cuts) : 10.312 +- 0.0051 nb)
Plots before cuts:
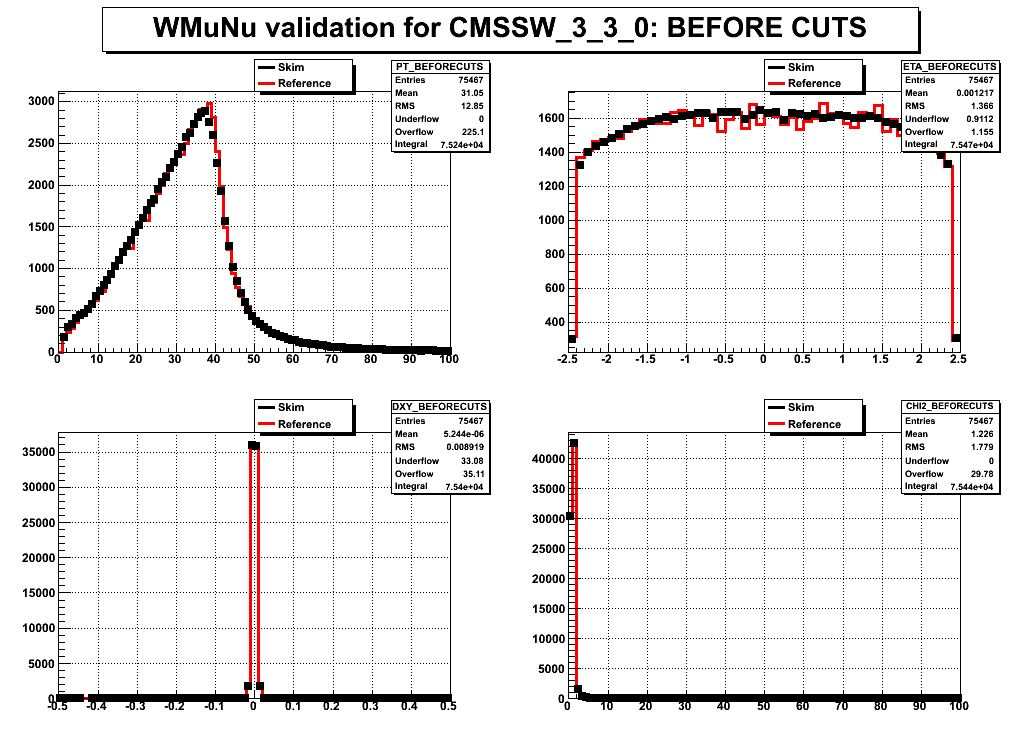
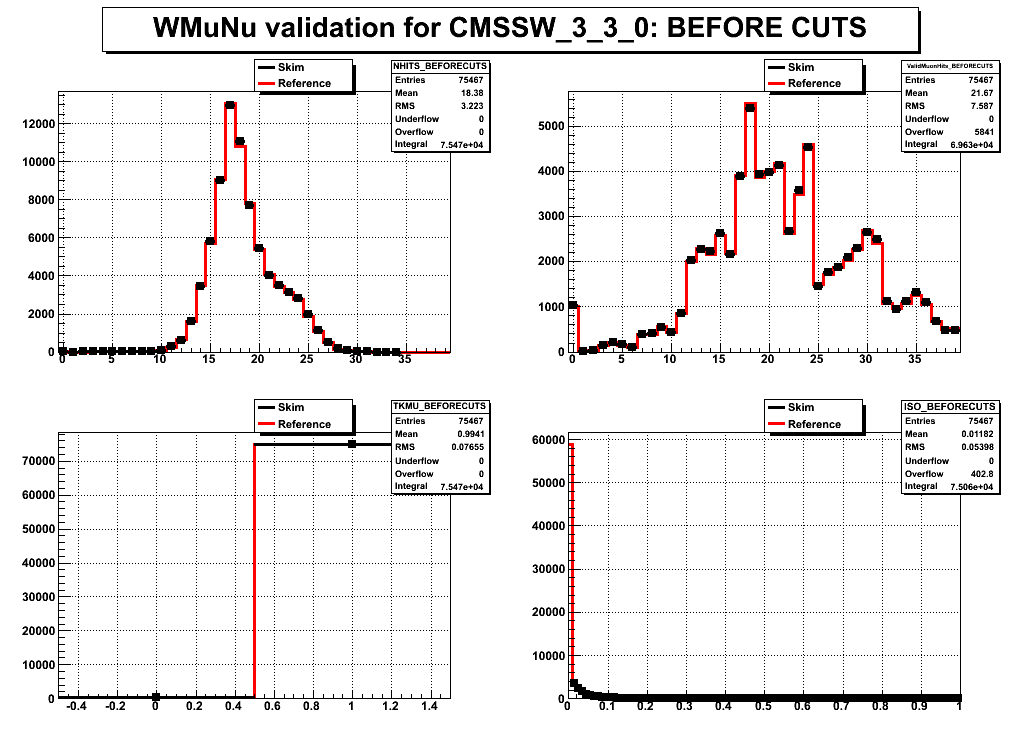
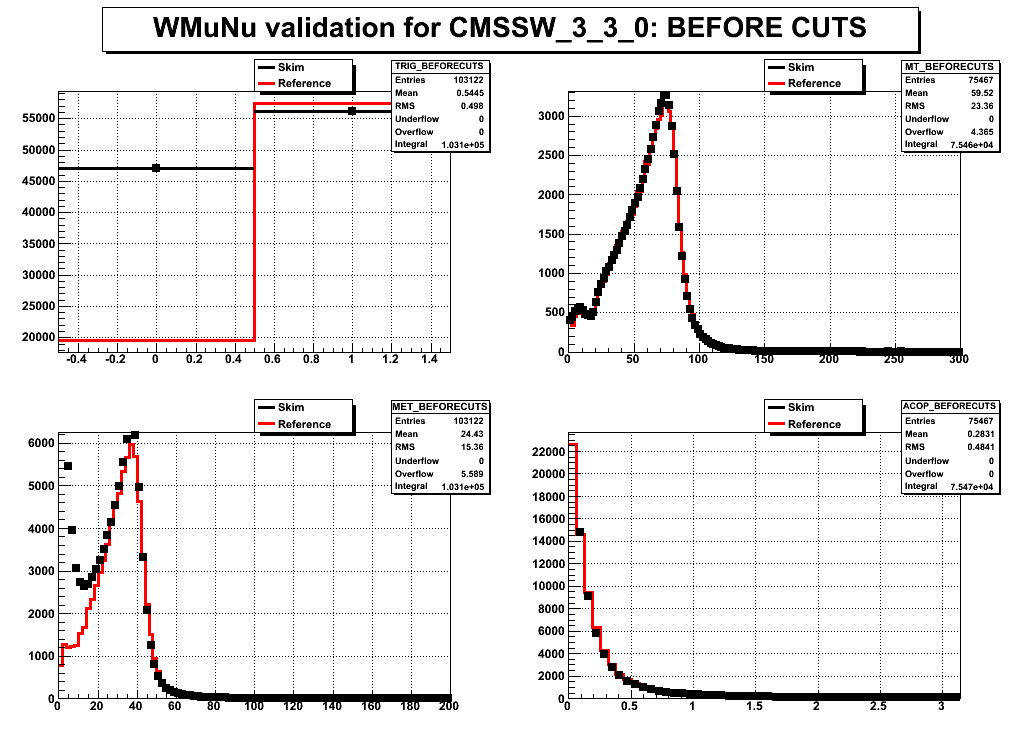
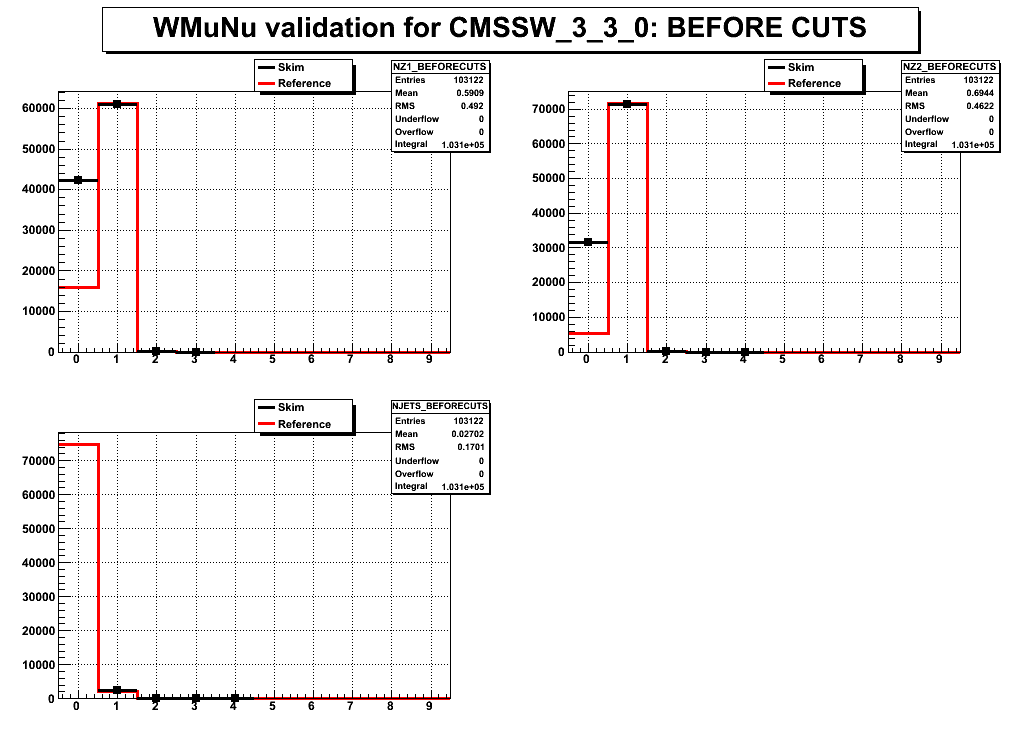
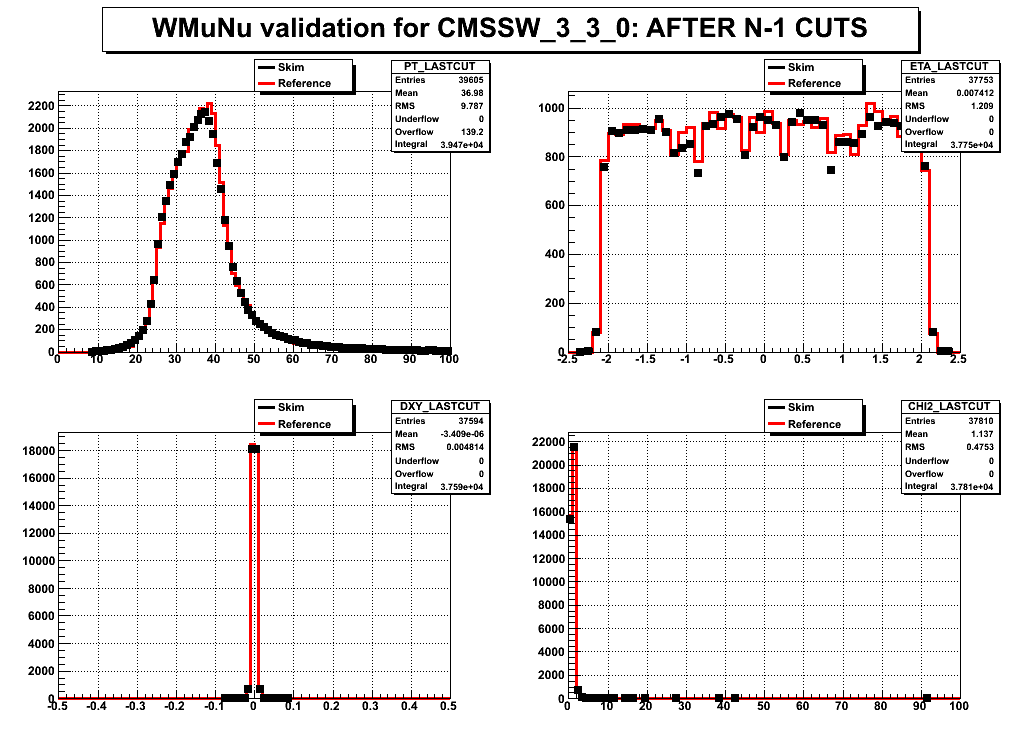
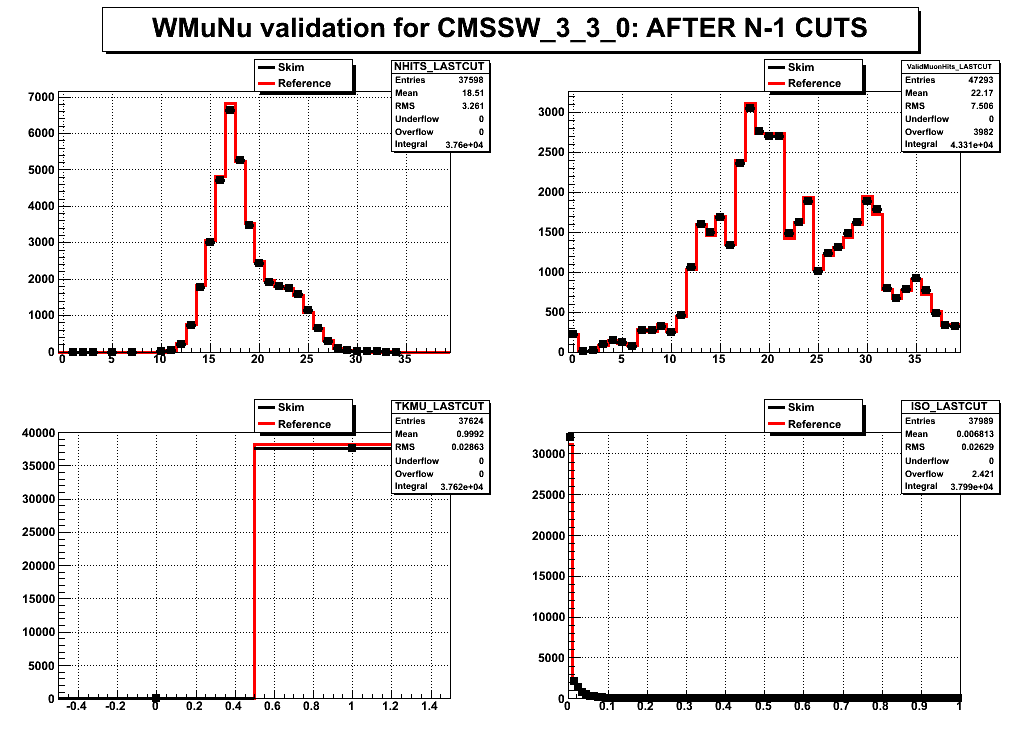
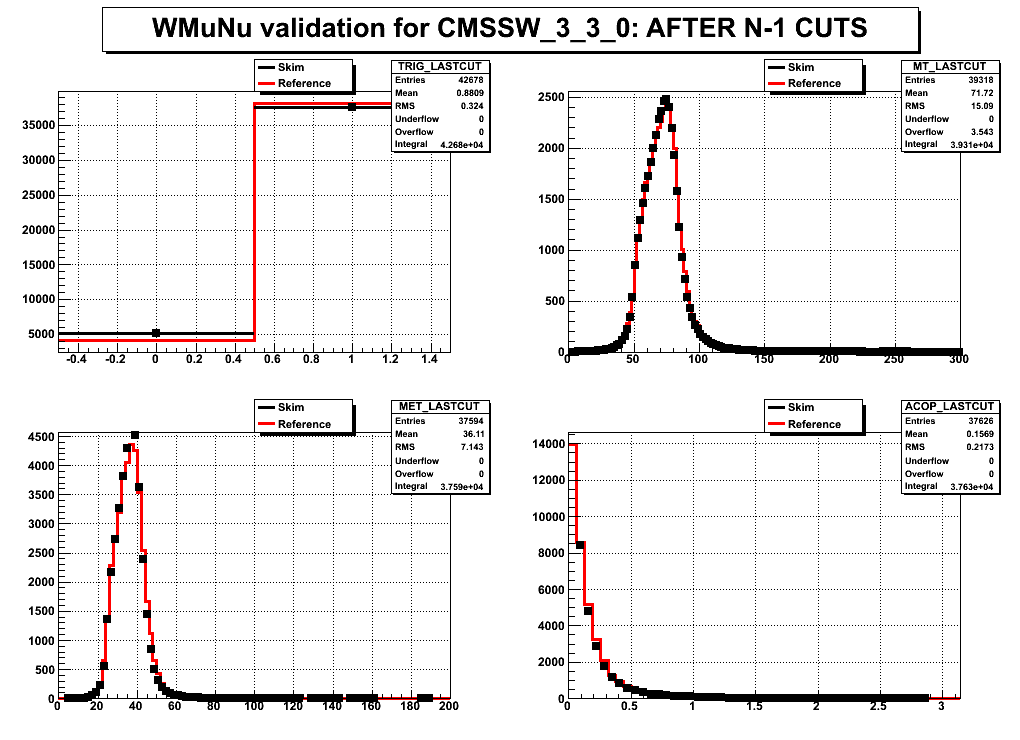
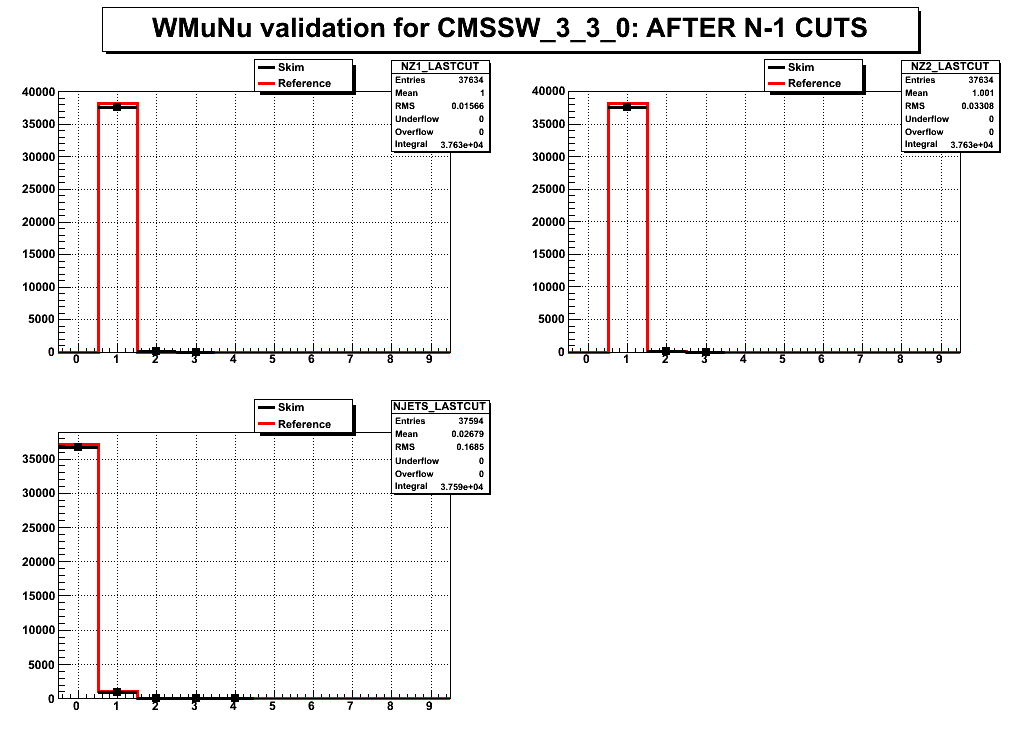
Plots after all cuts for WMuNu -1 have been applied:
Plots before cuts:


Plots after all cuts for WMuNu -1 have been applied:


